How can I perform a dotplot in python, which does not display squares but lines? That allows to adequately compare the two fasta sequences. I have managed to get a dotplot with the following code, but it is impossible for me to interpret anything.
import numpy as np
import os
import matplotlib.pyplot as plt

def dotplot (ruta1,ruta2):
    fichero = open (ruta1,'r')
    secuencia = ''
    for linea in fichero:
        if '>' not in linea:
            lineasinreto = linea.strip()
            secuencia += lineasinreto
    fichero2 = open(ruta2,'r')
    secuencia2 = ''
    for linea in fichero2:
        if '>' not in linea:
            lineasinreto = linea.strip()
            secuencia2+=lineasinreto
    matriz = np.zeros ((len(secuencia),len(secuencia2)))
    for i in range(len(secuencia)):
        for x in range (len(secuencia2)):
            if secuencia[i] ==secuencia2[x]:
                matriz[i,x]=1
    return matriz

a,=dotplot(os.getcwd()+'/fichero.fa',os.getcwd()+'/fichero1.fa')
plt.matshow(a)
I'd like to get something like this: http://biopython.org/DIST/docs/tutorial/images/dot_plot_scatter.png
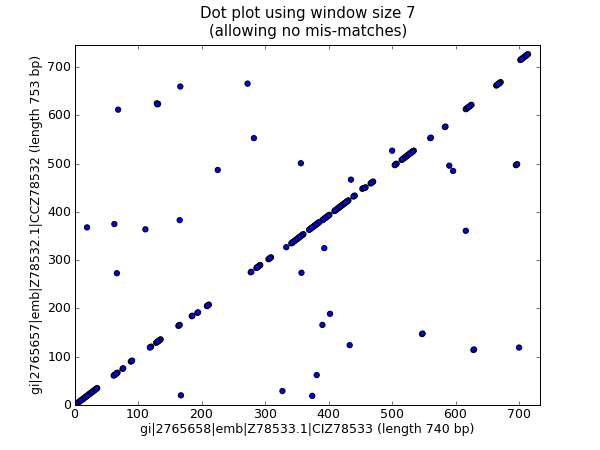
In the absence of your data, examining the function that reads it, I deduce that the result is a sparse matrix with zeros in most of its positions, and ones here and there in places that depend on the contents of the files you have read.
I'll create a similar matrix, randomly, with 100 columns and 50 rows, containing 100 randomly scattered ones:
Matplotlib provides the function
scatterplot()that produces the result you are looking for, only the inputs to pass to it are two lists, one with the coordinatesxand one with the coordinatesyof the points to display. Luckily it is easy to extract this information from our matrix:Now we can paint the scatterplot :
You can play with the parameters
s(size of each point) andmarker(shape of each point, try with"*","D","."for example or look at all the options . In my case it comes out: